Case study · Transform
Research in pursuit of product-market fit
A better way to make metrics meaningful?
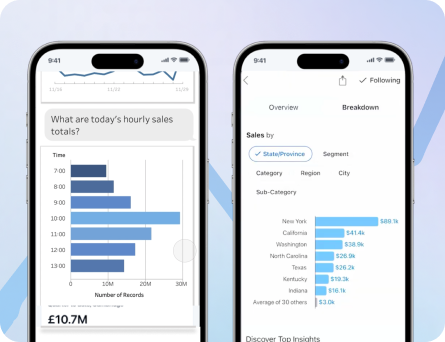
Transform helped data teams create a semantic layer and a trusted library of metrics and KPIs, but many customers still struggled to communicate the value of that work to non-technical stakeholders. We explored whether forecasting could help teams turn static metrics into forward-looking planning tools, and whether that direction was a better path to product-market fit than remaining a simple metrics catalog.
Background
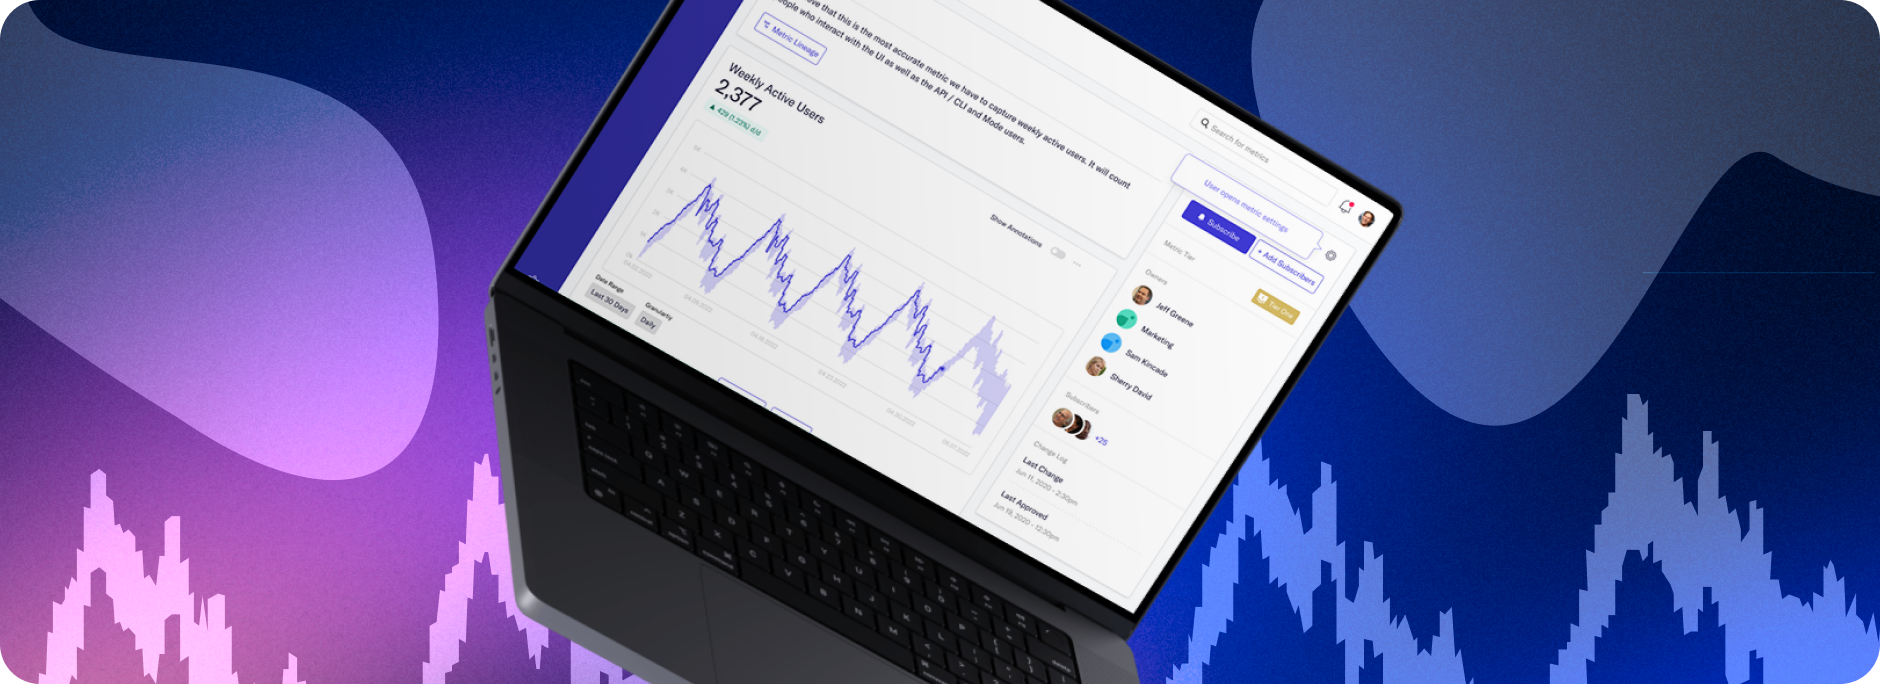
When I joined Transform, the team had built a strong foundation for defining trusted metrics, but the product stopped short of helping customers demonstrate business impact across the organization. The core tension was clear: technical users were investing time in building a robust metrics library, yet leadership still needed clearer, more visible outputs to understand why the product mattered.
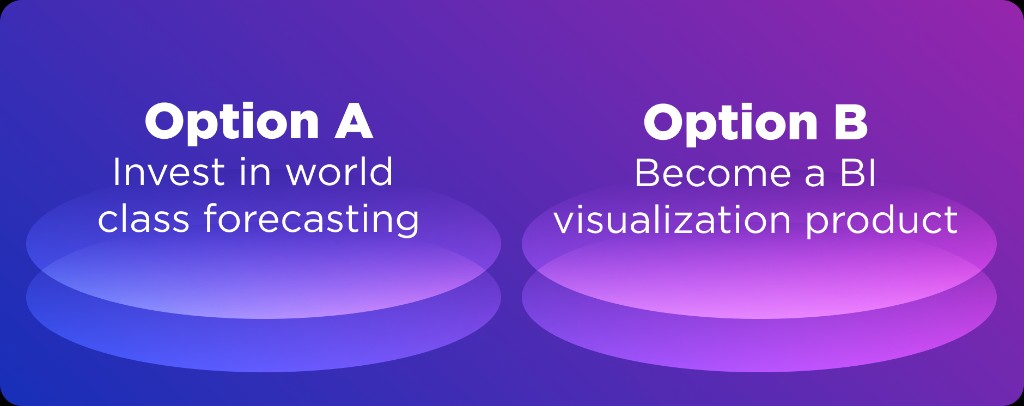
At the same time, the company was exploring where to go next. One path was a major pivot into BI by enabling teams to create visualizations directly in the product. Another was to focus on forecasting by helping customers compare actuals against projected outcomes across their metrics. The question for research was whether forecasting fit naturally into existing workflows and whether it could create enough visible value to justify investment.
Goals ✨
- Understand how customers currently create, manage, and use forecasts in their workflow.
- Learn who owns forecasts, who consumes them, and how they influence planning and reporting.
- Evaluate whether customers would want to upload forecasts into Transform, generate them in-product, or continue working in Excel.
- Identify where forecast-versus-actual comparisons should live: on metric pages, dashboards, alerts, or a dedicated forecasting area.
- Clarify whether forecasting was the right next bet for Transform's product strategy.
Format
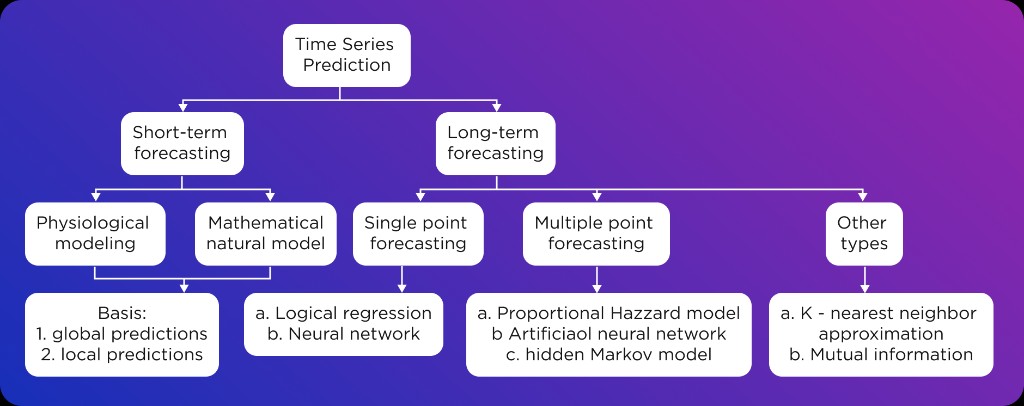
Phase 1: Competitive and domain discovery
We reviewed leading forecasting products and forecasting approaches to
understand the space before testing concepts with users. This included
looking at methods, workflow models, and how forecasts are typically
consumed in business settings.
Phase 2: Prototype exploration
I created Figma concepts that tested multiple directions, including
uploading an existing forecast and having a forecast generated within the
product. These prototypes gave participants something concrete to react to
during the study.
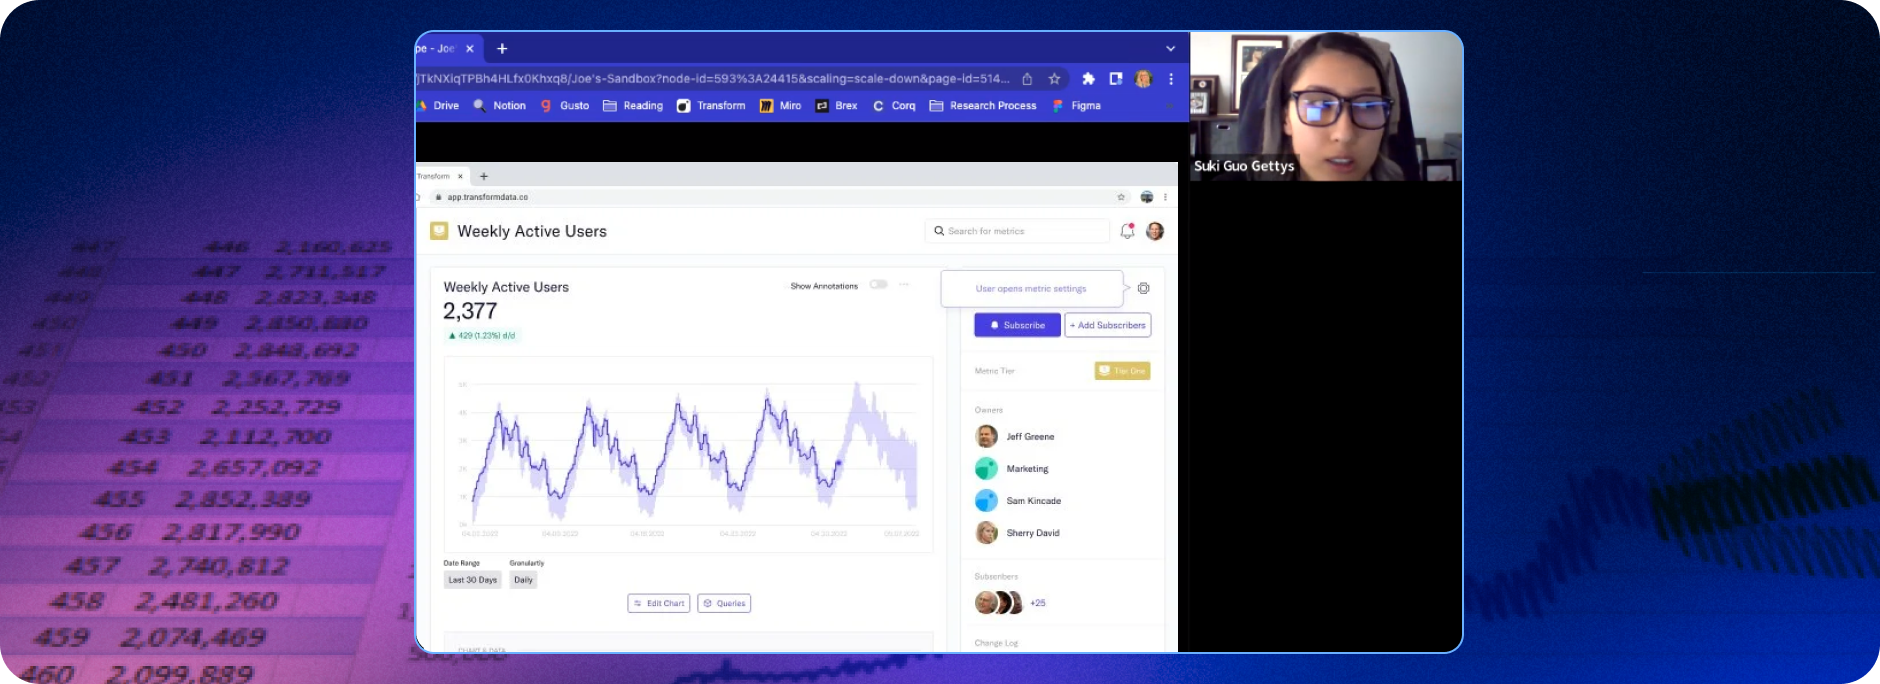
Phase 3: User study
We ran customer conversations and prototype walkthroughs to understand
current behavior, expectations, and perceived value. The sessions focused
on forecast ownership, update frequency, workflow fit, and where forecast
data would be most useful inside Transform.
Rationale: Because the product question was strategic, we needed to understand both current behavior and future expectations. A concept-driven study allowed us to evaluate not just whether users liked forecasting in theory, but whether it aligned with the realities of how planning already happened in their organizations.
Audience
- Existing and target Transform customers involved in metrics, planning, and reporting workflows.
- Participants from organizations with varying levels of forecasting maturity, including larger companies with more operationalized planning processes.
- Users who worked across technical and business contexts, including teams responsible for reporting upward to leadership and translating plans into operational decisions.
Insights · Discovery Phase
Forecasting was more complex than expected
One of the clearest findings was that forecasting was not a single, standardized behavior. Workflows varied significantly by company size, planning maturity, and organizational role, which meant a one-size-fits-all forecasting feature would be difficult to design with confidence.
Concept Evaluation
We tested two directions
The prototype explored a customer-uploaded forecast flow and an in-product generated forecast flow. This helped us compare whether users wanted Transform to become a place where forecasts were created, or a place where existing forecasts could be integrated, compared, and visualized.
Roadmap Validation
Forecasting alone would not give Transform credit
A key strategic insight emerged from the research: if customers exported forecasts into Tableau or another BI tool, those tools would appear to be the source of value. That meant Transform could build forecasting capabilities, but still struggle to get recognized as the product driving business insight.
Conclusions
This research helped the team move from feature exploration to product clarity. While forecasting was clearly relevant to customer workflows, the study showed that the deeper need was not simply generating forecasts, but helping customers communicate trusted insights in a visible, business-friendly way.
That finding directly influenced product direction. Rather than prioritize forecasting immediately, the team moved it further down the backlog and gained stronger conviction in the larger BI-oriented pivot, which offered a more direct path to demonstrating customer value within the product itself.
Limitations
Most of the participants represented larger organizations, which meant the findings may not fully reflect the needs of smaller teams. The research itself raised follow-up questions about what the right customer size actually was for this opportunity.
Important open questions remained around forecast-to-metric mapping, spreadsheet upload expectations, and how much work customers would tolerate to move forecasts into the warehouse.
Because forecasting workflows were highly varied, additional research would be needed before narrowing to a single product direction or interaction model.